Chart of the Day 9/8/25: Just How Much Could the Fed Cut NOW?
I'm sure you’ve heard a million “hot takes” about last week’s dismal jobs data. So, it’s time to focus on the NEXT logical question: Just how much could the Federal Reserve cut interest rates NOW?
My MoneyShow Chart of the Day here can shed some light on the subject. It shows what MARKET PARTICIPANTS believe the likeliest path is for interest rates over the coming year (as of Friday afternoon). The table is based on pricing in the interest rate futures markets, and it comes courtesy of CME FedWatch.
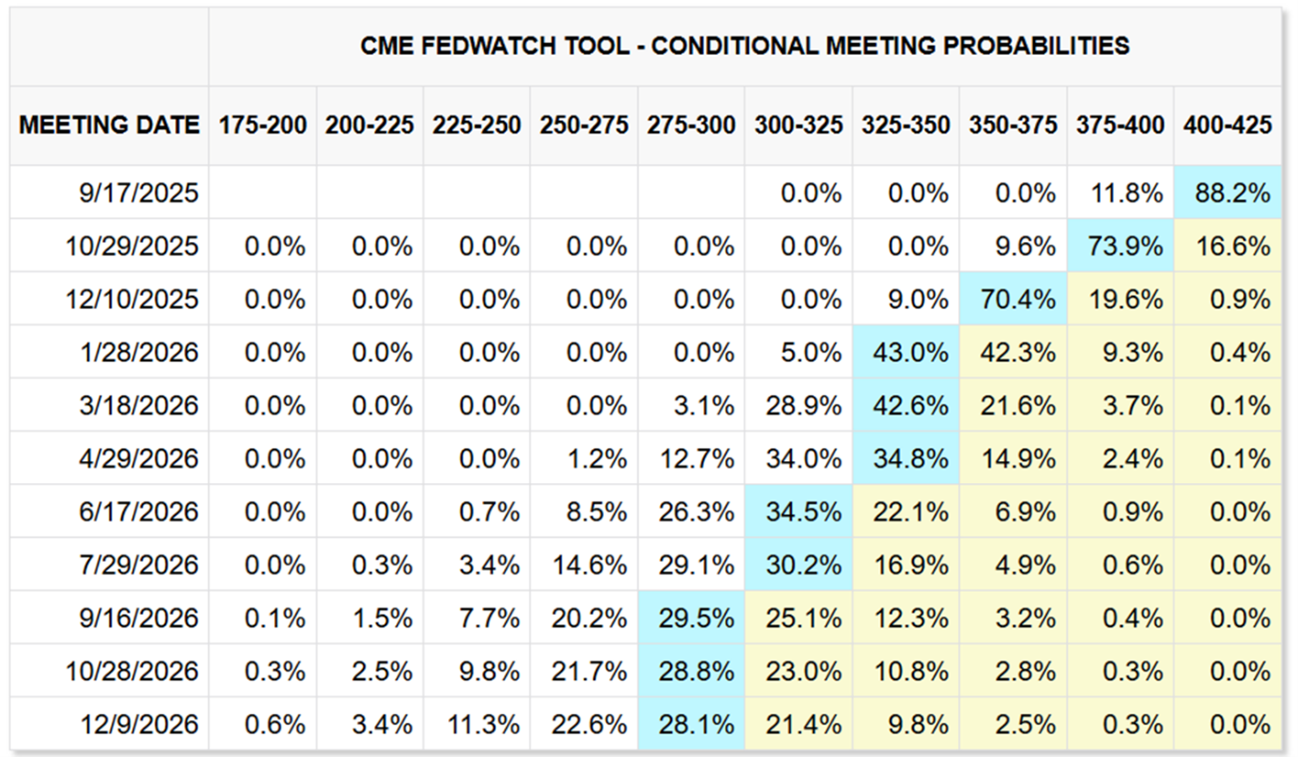
Source: CME FedWatch. Data Date: 9/5/25
Bottom line: A cut at the Sept. 17 meeting is locked in! The only question is, how big will it be? Markets were pricing in an 88% chance of a 25-basis point move…and a 12% chance of a 50-point cut. That’s a BIG shift in consensus thinking from where things stood a few weeks ago.
(If you want to get more articles and chart analysis from MoneyShow, subscribe to our Top Pros’ Top Picks newsletter here)
What about further down the road? Odds of additional 25-point cuts in October and December are hovering above 70%. Plus, the chance of ANOTHER 25 bp cut in January 2026 is 43%. If these forecasts pan out, that’s 100 bps (or possibly more) in cuts in just five months.
As for what it “means”…and what you can DO about it? The yield curve should keep steepening, gold should keep climbing, and the dollar should keep falling. You can profit from that in all kinds of ways, from buying certain ETFs like (GLD) or (UDN) to trading interest rate futures or futures options.
What about stocks? That’s the million-dollar question. Equity markets like “soft landing” scenarios. That’s when inflation cools, labor market tightness eases, and money gets cheaper...but confidence, business investment, and consumer spending don’t collapse.
SO FAR, Wall Street has been betting on exactly that scenario panning out. But the economic data bears watching. Ditto for market action. If volatility perks up, gold keeps rocketing, rates fall across the curve, and economically sensitive stock market sectors teeter, I’d consider it a “yellow alert” for the S&P 500 Index (SPY). And I’d consider lightening up or buying some downside protection.